Futures & Forex Performance
We show curves, not fairy tales. Backtests, walk‑forward results, and (if we flip it on) live tracking. Context over chest‑thumping.
Nasdaq Futures (NQ)
2008 - Present
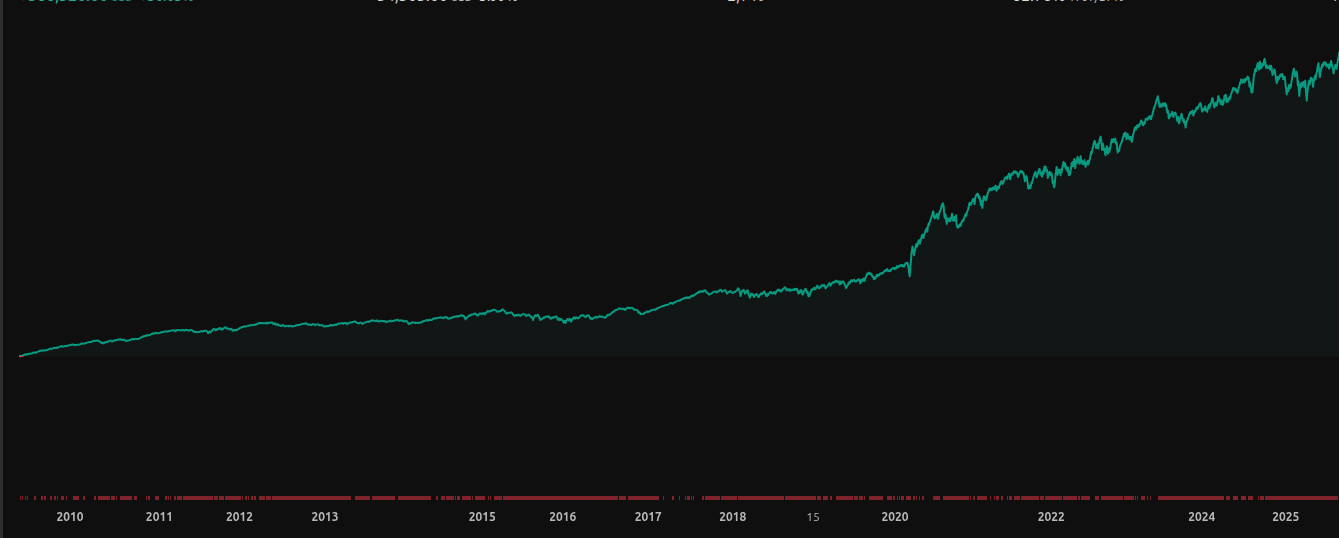
Total P&L
+$378,275
+37.84%
Max Drawdown
$54,505
3.96%
Total Trades
3,939
Win Rate
62.17%
2,449/3,939
S&P 500 Futures (ES)
2001 - Present
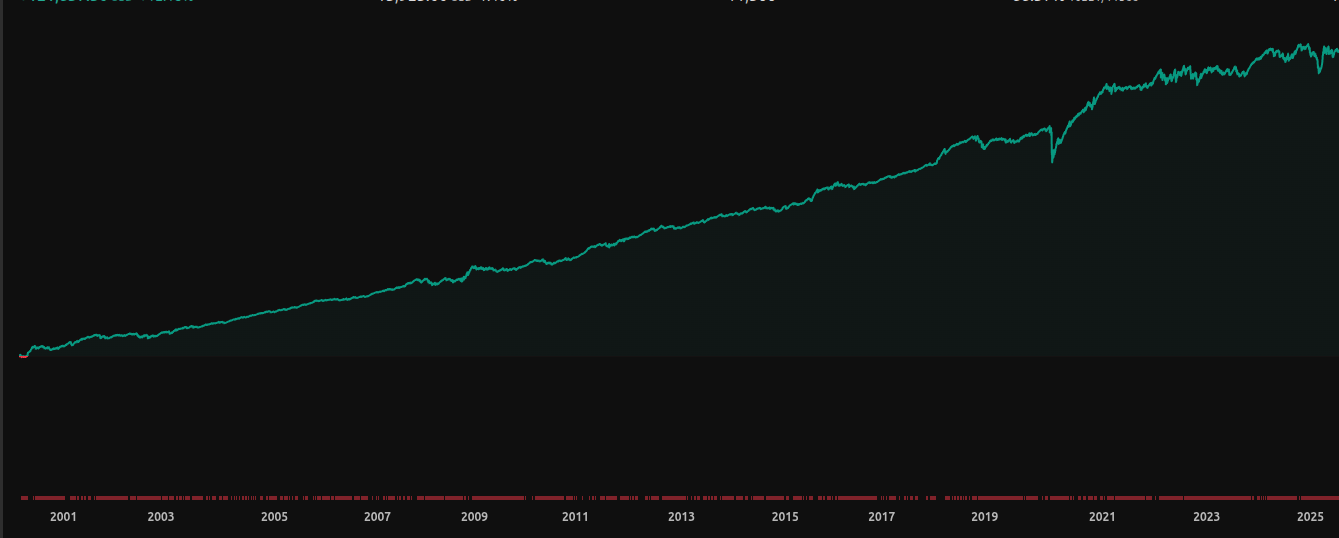
Total P&L
+$121,275
+12.13%
Max Drawdown
$15,925
1.46%
Total Trades
11,564
Win Rate
88.37%
10,219/11,564
Dow Jones Futures (YM)
2007 - Present
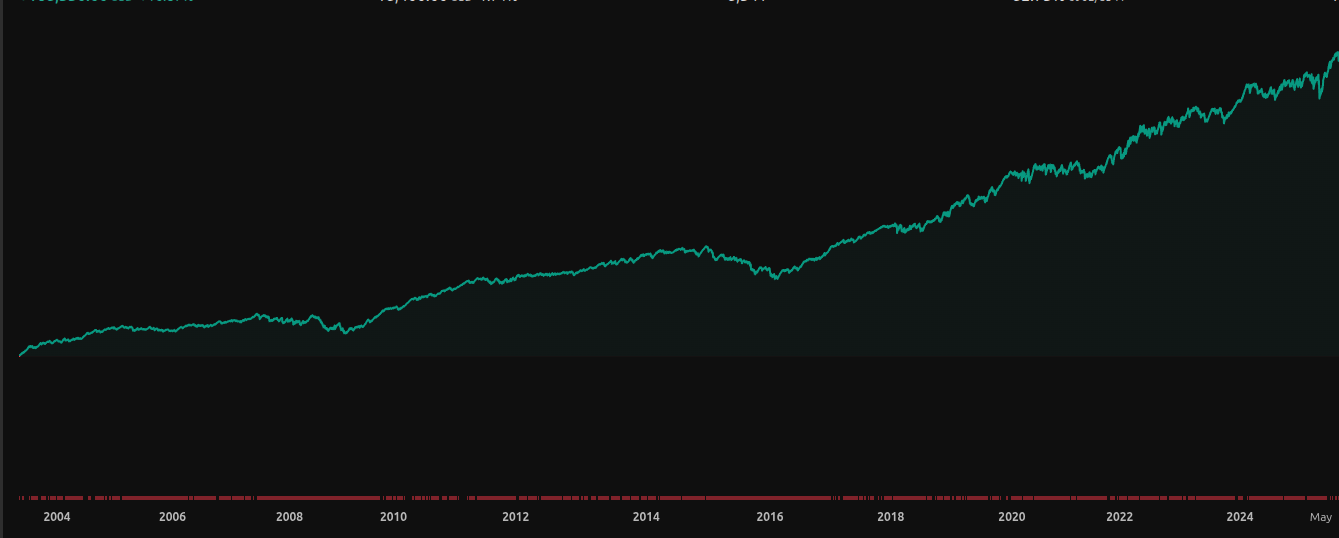
Total P&L
+$157,375
+15.75%
Max Drawdown
$18,400
1.75%
Total Trades
8,530
Win Rate
82.61%
7,047/8,530
CAD/USD (Forex)
2008 - Present
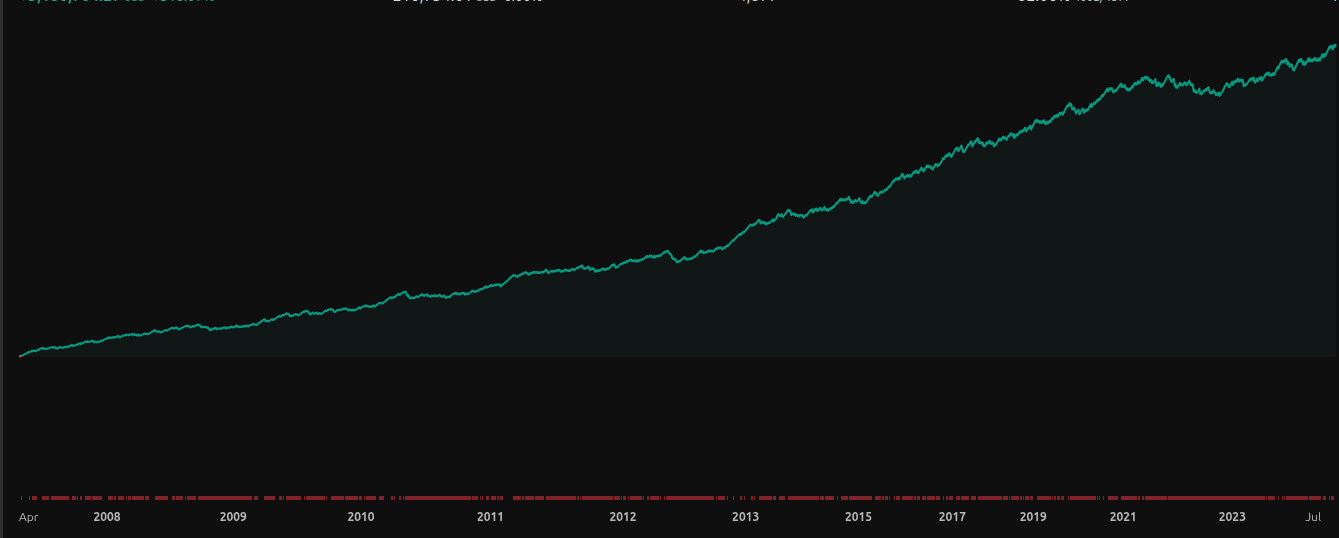
Total P&L
+$3,180,704
+318.07%
Max Drawdown
$216,734
6.00%
Total Trades
4,877
Win Rate
82.06%
4,002/4,877